Volume Profile Visible Range is a powerful tool that helps you visualize how much and where volume was traded within an area that you define on your chart.
VPVR trading strategies revolve around defining ranges, observing POCs, and watching for breakouts of the value range. VPVR works great in combination with Aggr, volume-based indicators, and VWAP trading strategies.
Download VPVR Trading Strategy PDF
Like most indicators, VPVR can be confusing when you first turn it on. Fortunately, we have EmperorBTC, who created a PDF that simplifies VPVR, even if you’re completely new. Give EmperorBTC a follow on twitter.
The VPVR Trading Strategy PDF by EmperorBTC looks at trading the value area range, trading breakouts and how to use VPVR as a part of your overall strategy.
This VPVR tutorial provides a useful introduction to the VPVR indicator and will teach you strategies for better navigating ranging markets.
Download the VPVR Trading Strategy PDF here.
How To Read VPVR
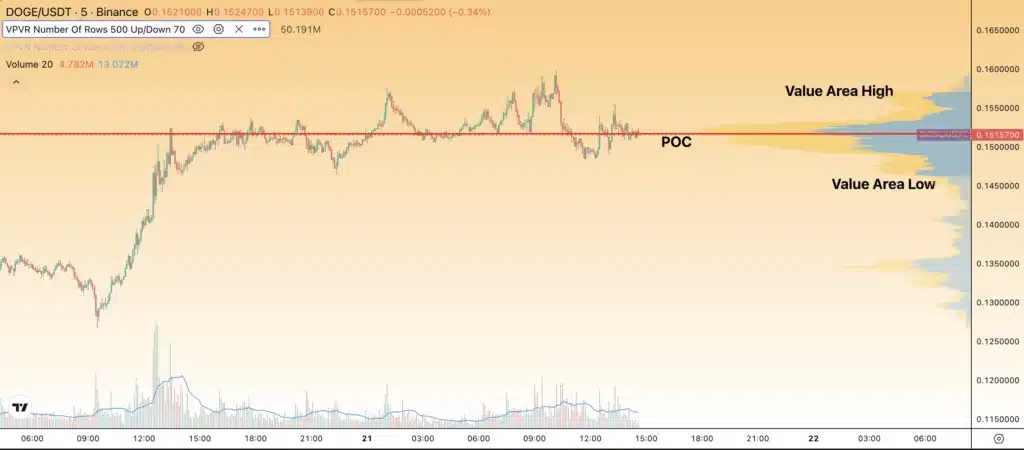
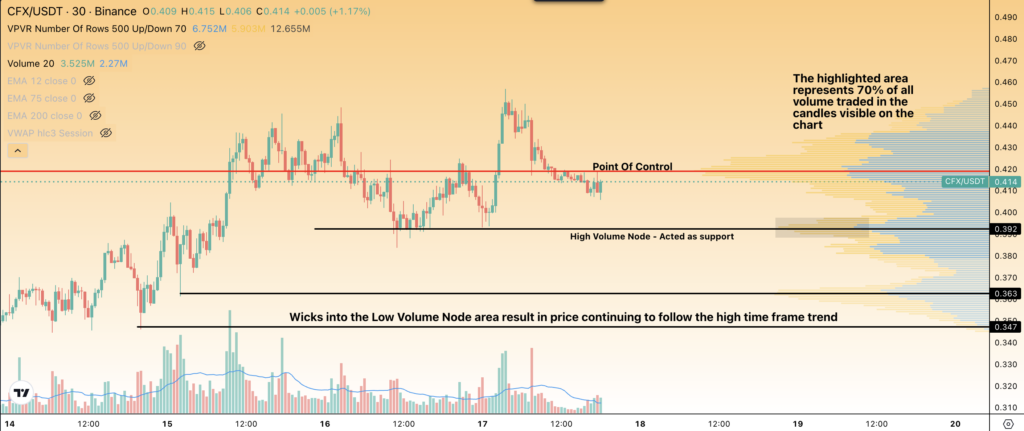
Value Area – “Value area” refers to how much volume was traded within the candles visible on your chart. The default setting for the VPVR indicator is to highlight where 70% of the volume was traded within the visible range.
Value Area High (VaH) – Value Area High refers to the top of the visible value area.
Value Area Low (VaL) – Value Area Low refers to the bottom of the visible value area.
POC – The Point of Control is where the most volume was traded within a visible range. POCs are marked by the red line.
High Volume Node – High volume nodes are potential support and resistance areas since price tends to find acceptance in areas where lots of trades are executed. You can identify high-volume nodes by looking for bars that stick out further than the other bars.
Low Volume Node—Low volume Nodes are ideal places to execute trades since they are usually at the extremes of a high volume node. Price usually moves quickly through Low Volume Nodes, which can be the start of a trending move.
When price is stuck in a high-volume node, you can expect a ranging environment. When the price moves toward a low-volume node, you can look for quick moves and either a continuation or change in the trend.
VPVR Settings
Rows Layout – You can look at VPVR two ways: numbers per row or ticks per row. Both these settings change how the VPVR indicator aggregates volume and groups price levels together.
Numbers per row is useful for getting a broad overview of the volume distribution on your chart. Numbers per row makes it easy to see high time frame trends.
Ticks per row is a good option when you need granular detail on your chart. You can use ticks per row to zoom in and find support/resistance levels that work well on low time frames. You can use numbers per row to get an overview of important levels, then use ticks per row to dive into specific levels.
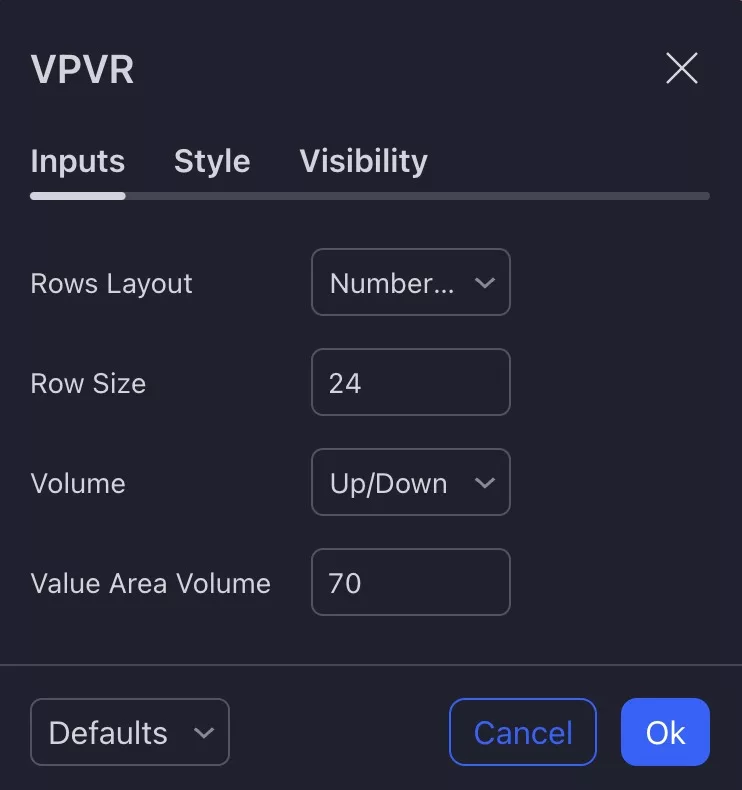
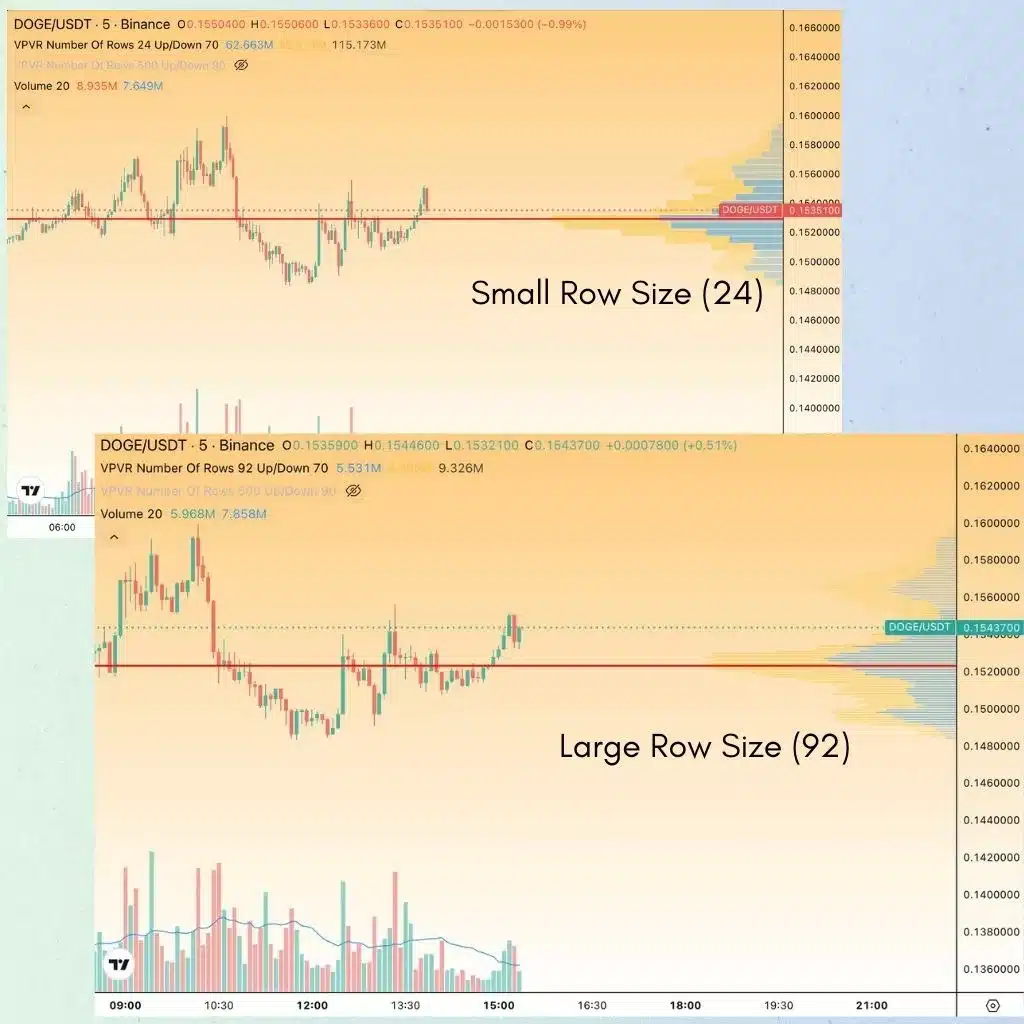
Row Size
The row size setting sets the width of each row on the chart, allowing you to change how generalized or detailed the VPVR indictor appears. Small row sizes show more detail and can help you identify local support/resistance areas. Large row sizes are great for a generalized overview of where volume was traded on your chart.
Small row sizes can help you locate areas with lots of trades which can act as reversal zones on low time frames. A large row size can help you filter out noise and focus on levels that provide reactions on a high time frame.
Volume – This setting allows you to visualize up and down volume, total volume, or volume delta for the visible range.
Value Area Volume – This is the percentage of total volume traded highlighted by the VPVR indicator. The default setting shows 70% of all volume traded.
Places to use VPVR:
If you don’t have a paid TradingView account, you can use the VPVR indicator on the websites below:
- Dexscreener
- Coinalyze
- https://birdeye.so/token/ – requires making a free account to access indicators.


If You Use VPVR, Download This VPVR Trading Strategy PDF