
Beep. Ding. Boop. Badoom. Boop. Ding. Beep. Bling. Badoom. Ding. Bong. Bong. Beep. Badoom. Bong. Bling…
If you’re not waking up in the middle of the night with these sounds stuck in your head, don’t worry; by the end of this article, you will be.
Aggr is a beautiful open-source tool that you can use to get real-time information about cryptocurrency markets.
With Aggr, you can see and hear the flow of trades coming in and out of the main crypto exchanges. Listening to Aggr slowly gets you in tune with the flow of the market. Aggr uses dynamic audio feedback to deliver different noises for buys, sells, and liquidations. After a while, you start to make sense of these jumbles of sounds.
Aggr is also a great tool for analyzing CVD across all the major exchanges. With Aggr, you can see spot and perpetual trades in real time, making it easy to see which exchanges are leading the market. When the market is at key pivot points, Aggr will show you liquidations across all exchanges, funding rates across the market, and pivots in net buying and selling.
This article looks at how to install Aggr templates and what to look for when using these templates in your market analysis. This article uses templates created by CryptoRife & 0xd3lbow. Make sure you check out 0xd3lbow on GitHub and give CryptoRife a follow for quality insights into crypto markets!
Download Aggr Templates
Use the Mega link to download the templates. Click on the “Full” folder to get the templates that include the spot order book, perp order book, CVD, basis, and price chart.
https://mega.nz/folder/ECUkECRL#AOdb2T-BCIKASNAy0dTweg
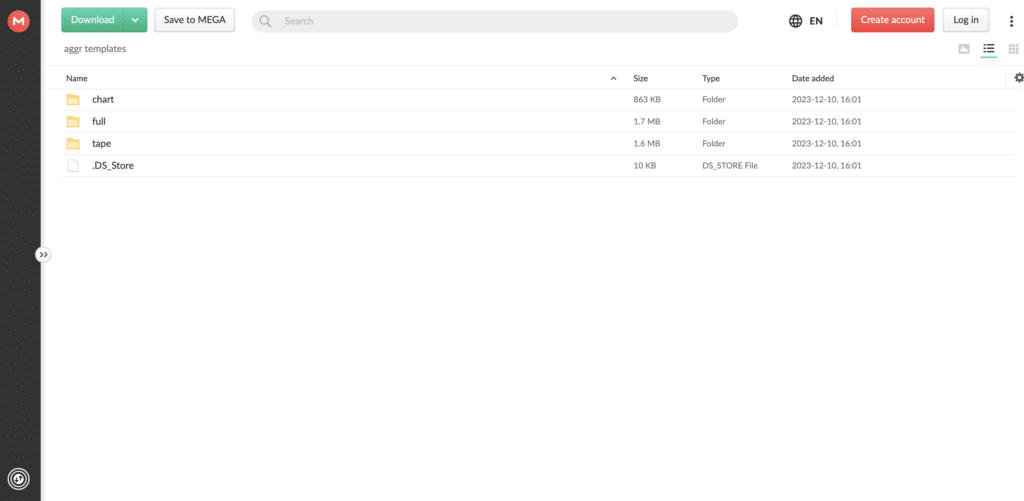
In the “Chart” folder you’ll get templates with just the chart and the “Tape” folders contains both spot & perp order books without any other information.
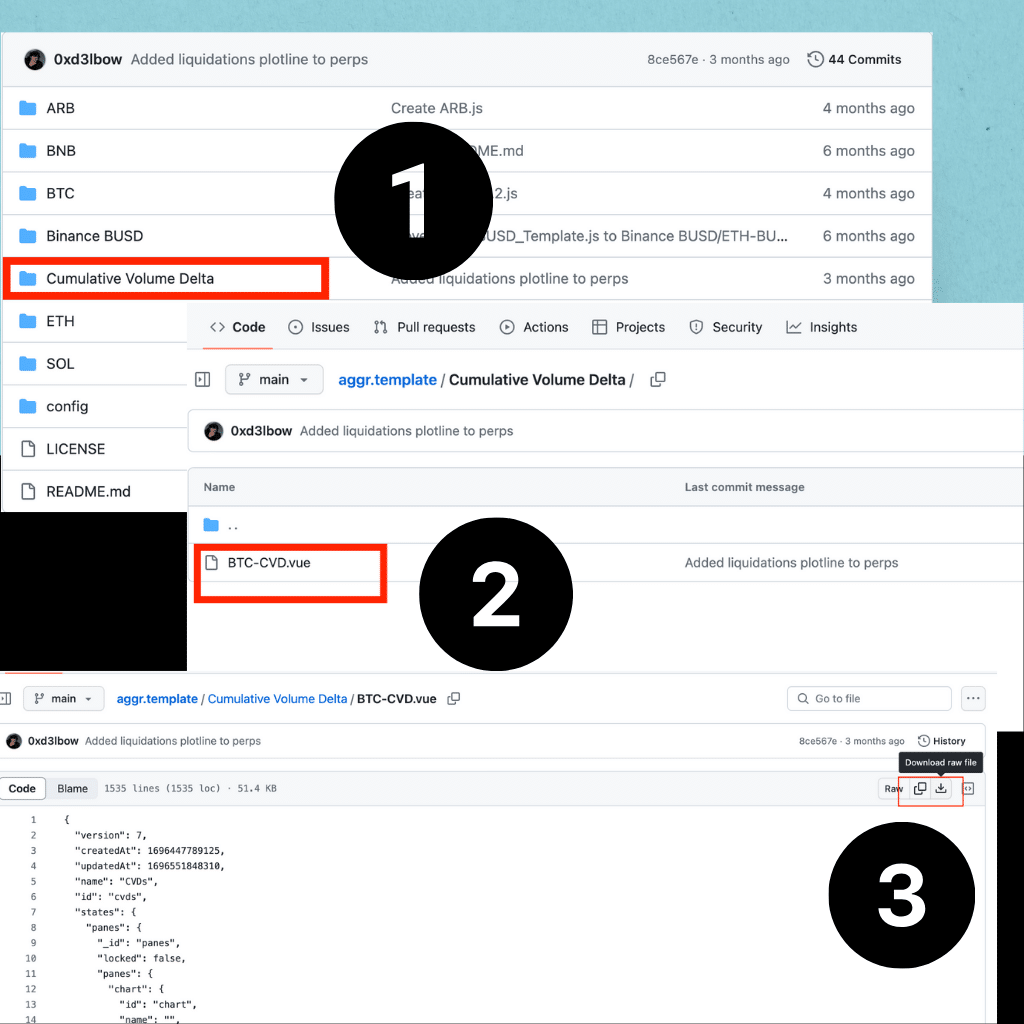
You can download 0xd3lbow’s templates via their GitHub – https://github.com/0xd3lbow/aggr.template
Download the Bitcoin CVD Aggr template here.
All 0xd3lbow’s templates are inside folders on GitHub. Start by clicking the folder you want, then click the template you want to download, then click the download icon on the right side of the screen.
How To Install Aggr Templates
Once you have your templates downloaded, head to Aggr and click the three dots in the bottom right corner. Then click settings.

With the settings page open, click on New, then click “upload template file”.
Now, look for the template on your computer and upload the file.
CryptoRife’s template are in the .json format. 0xd3lbow‘s templates are in .vue and .js formats.

What Should I Look At In Aggr?
Spot Order Book
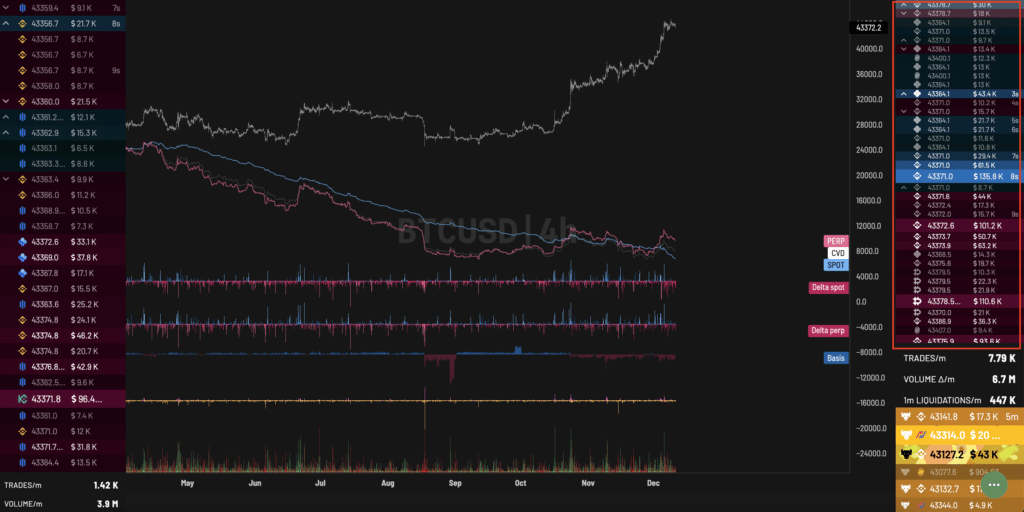
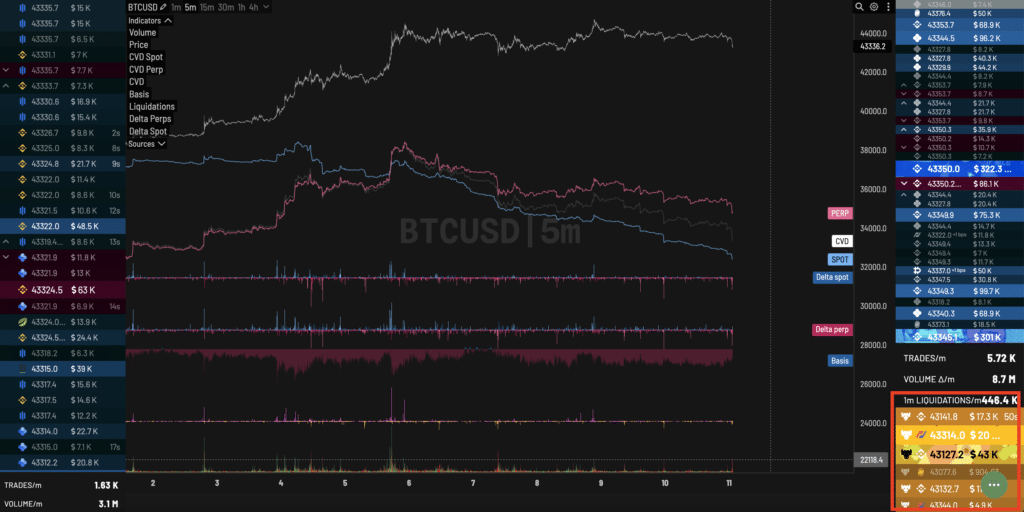
Starting with CryptoRife’s template, the left section of the screen, highlighted by the red rectangle, shows you the buy and sell orders for the spot order book.
Spot purchases are important because they represent people actually buying and selling the underlying asset. Spot orders are settled immediately, and users can buy/sell/trade their tokens within minutes of making a purchase.

A large increase in spot purchases can indicate a bullish market since it shows demand for the underlying asset. Spot purchases are less likely to come from speculators and more likely to come from medium or long-term holders. Spot buyers react less to intraday price movements since they aren’t using leverage.
On the other hand, an increase in spot selling can indicate a bearish market. When people no longer want direct exposure to the underlying asset, it’s usually a sign of people losing confidence in the token or protocol for whatever reason. An increase in spot selling can indicate medium to long-term holders are exiting the market.
Watching what the spot order book is doing at key high time frame levels can give you insight into developing trends. The spot order book CVD is represented by the blue line.
Perp Order Book
On the right hand of the screen, you can see the order book for perpetual buy and sell orders. With perpetual contracts, people can speculate on crypto assets without actually holding the tokens. Perps also allow people to add leverage to their position.
Since people are speculating without actually owning tokens, perpetual markets are balanced by periodic funding payments. Funding payments occur between long and short contract holders to help exchanges balance the long/short ratio.
Again, watching what the perp order book is doing at key levels can help you assess the momentum of the market. The perp order book is represented by the pink line.
What Is Cumulative Volume Delta?
Spot CVD & Perp CVD
In the images above, you can see the blue and pink lines that represent the flow of orders from both the spot order book and the perp order book.
However, it’s essential not to take these lines at face value. These lines represent the cumulative volume delta (CVD) of both order books. CVD shows you the difference between total buy and sell volumes for each order book. Because these lines represent the difference between two types of volume (instead of showing net volume), you can’t blindly follow them to determine the direction of the market.
Large orders, lack of liquidity, and limit order absorption are some reasons why CVD can look like it’s going down, but there are actually more buyers in the market. Using CVD in combination with the Basis indicator will help you get a clearer picture of the market.
Liquidations
In the bottom right hand corner of this Aggr template, you can see all the liquidations across all order books in real time. This is useful for seeing which type of buyers are offsides.
Aggr Templates For Bitcoin CVD
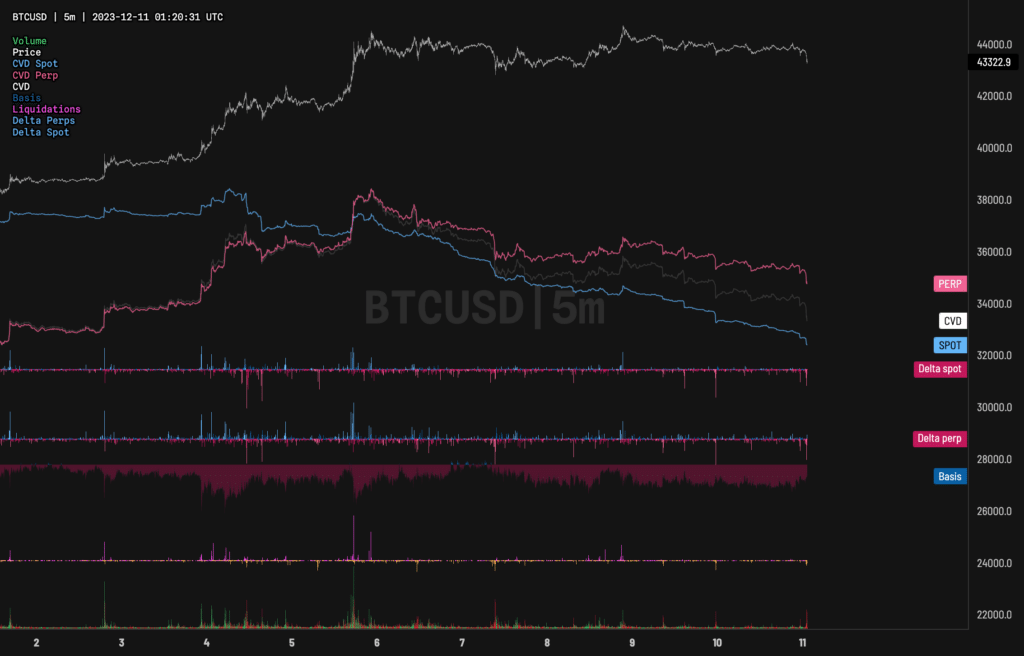
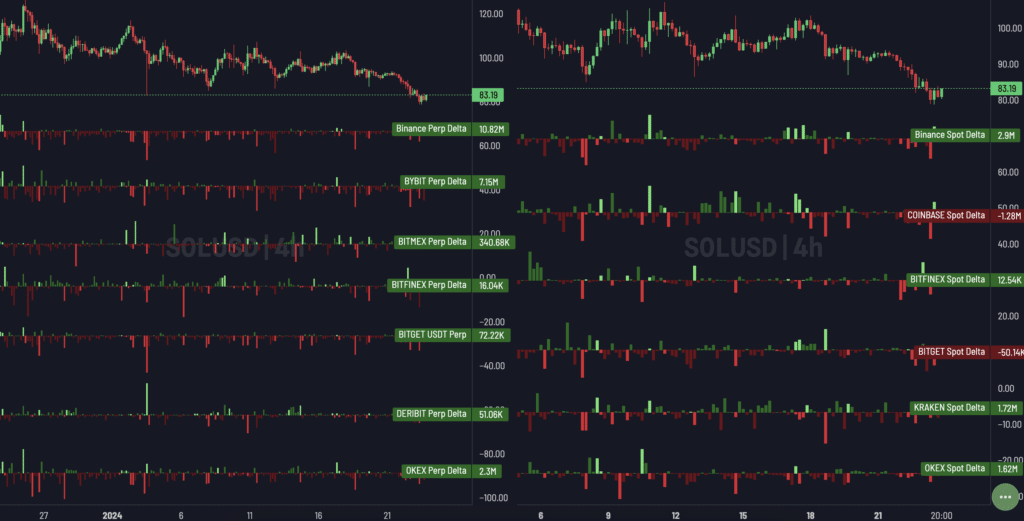
0xd3lbow created an extremely useful template for comparing exchange CVDs against each other on Bitcoin.
While this template doesn’t give you any insight to exchange order books, it makes comparing CVD inflows/outflows between the different exchanges easy.
On the left side of the screen you have spot CVD and the right side is perp CVD. Under the CVD lines you can see the total delta across all exchanges for both spot and perp books.

This is a great template to use to help you decide if a move in price is fueled mostly by spot or perps. Depending on which exchanges are leading the move, you can tell which countries/trading sessions are buying or selling.
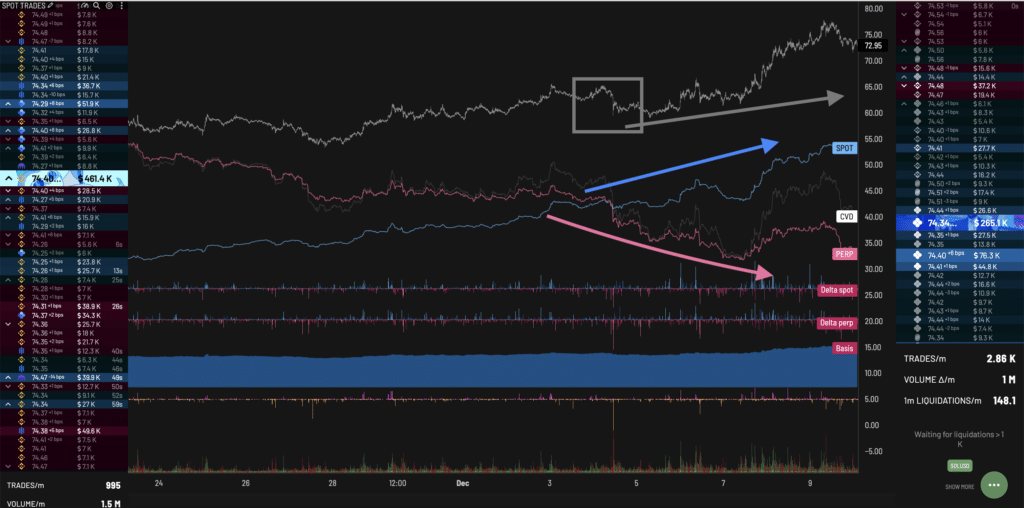
Spot Vs Perp Delta Template
0xd3lbow created another useful template for comparing spot and perp volume across all exchanges.
This layout makes it easy to compare price movements with reactions created by spot or perp orders.
How Do You Act On Information From Aggr?
Look For Divergences
One of the most common ways to use this information is by looking for divergences between the spot order book and the perp order book.
For example, let’s say the price of an asset goes down 10%. You fire up Aggr and see a huge decline in perp orders while the spot order book is more or less in the same position. With this information, you could infer that the market is still bullish despite the sell-off since spot holders (people actually holding the asset) aren’t selling their positions. This type of divergence between perps and spot is common when a sharp decline in price wipes out all the people holding high-leverage positions.
On the other hand, imagine that the price still declines by 10%, but this time, it’s the spot order book that is declining sharply. When people don’t want exposure to the underlying asset, it’s usually a cause for concern. If long-term holders and large holders are exiting the market, it can indicate strength in a bearish trend. A decrease in spot buying can become even more bearish when accompanied by people chasing prices on the perpetual order book.
In the image below, notice how the sell-off is mostly limited to the perp order book. Perp CVD declines while spot CVD slowly continues to increase. Despite the decline in price in the grey box, the overall uptrend still remains in tact and price continues up soon after.
Listen For Activity
When scalping on low time frames, you can use Aggr to ensure you’re trading with the momentum of the market. When the Aggr noises start going crazy, look at what price is doing and who is getting liquidated. If the increases in activity are accompanied by bears getting liquidated, you probably want your next scalp to be a long.
Waiting for these spikes in Aggr activity to time your trades can help you avoid choppy conditions. When Aggr is relatively quiet, you want to wait for price to move to an area with more activity. Technical analysis on your charts will help highlight these areas of confluence where you can execute trades with higher confidence. Aggr is most powerful on low time frames (1m, 5m, 15m)
Observe What Both Order Books Are Doing At Key Levels
Looking for divergences and changes in momentum works best at key high time frame levels. Using basic technical analysis, you can find daily or weekly levels that act as support and resistance.
Once the price moves toward these levels, using Aggr and looking for divergences between the two order books can help you make better decisions.
Look at volume
Volume is another indicator that works well in combination with Aggr. If you’re seeing a huge sell-off, compare the volume chart from where it’s currently at to other sell-offs in the past. Using Aggr in combination with VPVR can help you contextualize price movements and help you avoid letting violent moves on a low time frame cloud your judgment.
While spot selling can be a sign of bearish-ness, if the selling is on low volume, you have less reason to be concerned. Same for a sharp move up on low volume. Low-volume moves can easily get wiped out by buyers/sellers with high conviction.
Summary
- Aggr is an open-source tool you can use to get real-time updates on cryptocurrency assets.
- Aggr uses dynamic audio feedback for different types of trades
- Listening to Aggr can help you get in tune with the flow of the market
- Spot Order Book:
- Represents immediate buy/sell orders for the underlying asset.
- Spot purchases can indicate bullish markets, since they usually come from medium to long-term holders.
- Spot selling can indicate bearishness & a loss of confidence in the asset.
- Spot selling can also indicate a desire by medium to long-term holders to de-risk their portfolios.
- Use Spot buying/selling pressure to help you evaluate market conditions
- Perp Order Book:
- Displays buy/sell orders for perpetual contracts, allowing speculation without holding tokens.
- Perpetual markets get balanced by periodic funding payments.
- Monitoring perp order book provides insights into market momentum.
- CVD (Cumulative Volume Delta):
- Blue (spot) and pink (perp) lines represent CVD, showing the difference between total buy and sell volumes.
- Caution: CVD doesn’t indicate net volume and may be influenced by large orders, lack of liquidity, or limit order absorption.
- Use CVD in conjunction with the Basis indicator for a clearer market picture.
- Taking Action On Information from Aggr:
- Look for divergences between spot and perp order books during price movements.
- Example: If perp orders decline while spot orders remain stable during a price drop, it may signal a bullish market.
- Observe Order books at Key Levels:
- Look for spot buyers to step in at key levels
- Perp order books should be aggressively bullish or bearish during a trending market
- Look for divergences between spot and perp order books during price movements.
- Consider Volume:
- Volume is an important indicator to complement Aggr’s insights.
- Use volume to help you contextualize and validate market trends.
- Download Aggr templates here


Download Aggr Templates For BTC, ETH, SOL & More