The only negative of using Aggr is the struggle to get the sounds out of your head. Other than that, if you’re trading crypto, Aggr offers such a wealth of information there’s no reason not to use it.
Aggr is an open-source tool that aggregates data across all crypto exchanges. You can use this tool to your advantage to see where people are actually buying tokens (spot) and where people are chasing on leverage (perps.) Aggr also offers some features that are only available with a paid TradingView account. In this article, we’ll look at 3 ways you can use the Aggr tool to better absorb information on the market.
Use Aggr To Scalp Low Time Frames
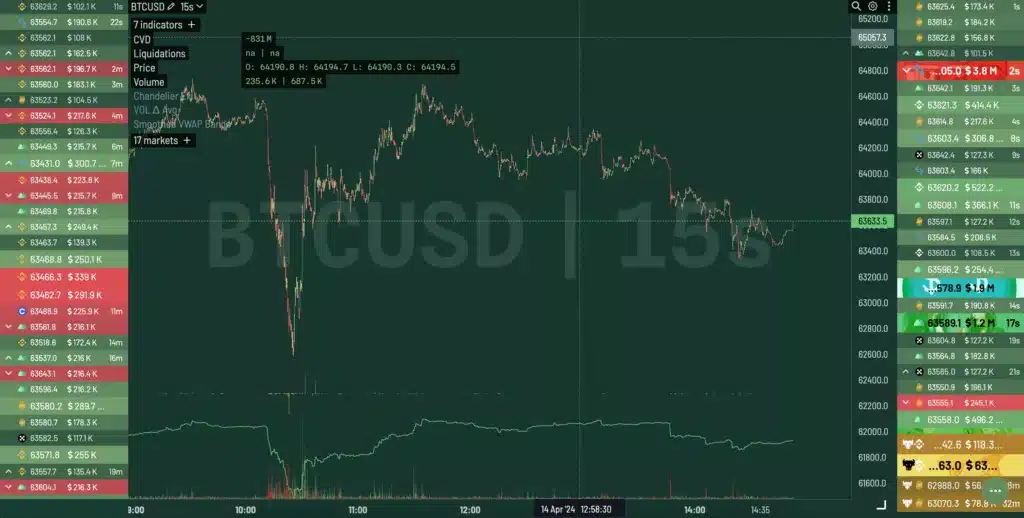
If you don’t have the paid version of TradingView, Aggr is an excellent alternative. Aggr allows you to view charts on super-low timeframes, which helps you see how the market is developing in real-time.
On Aggr, you can use 15-second or 20-second charts to help with your scalping while using key levels from the 5-minute and 15-minute charts to define potential support/resistance areas.
Using a super low time frame, like 15s, makes it easier to see momentum building up in real-time. On the 15s chart, you should see a series of higher lows if price action is bullish. If the market is bearish, you’ll notice a series of lower highs where the highs can’t get broken even on a super low time frame.
Another benefit of the 15s chart is you can see how the price is reacting to key support levels. Once you identify your key points of interest, you can study how price action develops around these areas. Again, if bears are in control at a key level, you’ll see a series of lower lows with highs that aren’t broken. If bulls are in control, you’ll see that the local lows on the 15s are holding and followed up with higher highs.
Aggr’s 15s chart is also great for identifying breaks in market structures. Once a series of higher highs and higher lows leads to a new local high, watch what happens when the price interacts with the low that created this new high. If price makes a higher low or an equal low, you can assume bullish price action will continue.
However, if price can’t break any highs after interacting with that key low, there’s a good chance the developing price action is flipping bearish. You can use this information in combination with volume profiles and points of controls to make trades in sync with the market.
Use Indicators From The Aggr Community
As an open-source tool, Aggr also has a library of indicators shared by a community of developers. You’ll find many common indicators, such as RSI, MACD, and Bollinger bands, but Aggr also introduces a few indicators unique to the community.
CVD is a great indicator to use along with volume to tell if buyers or sellers are in control. Aggr makes it easy to isolate spot CVD and perp CVD so you can see divergences between the two types of orders.
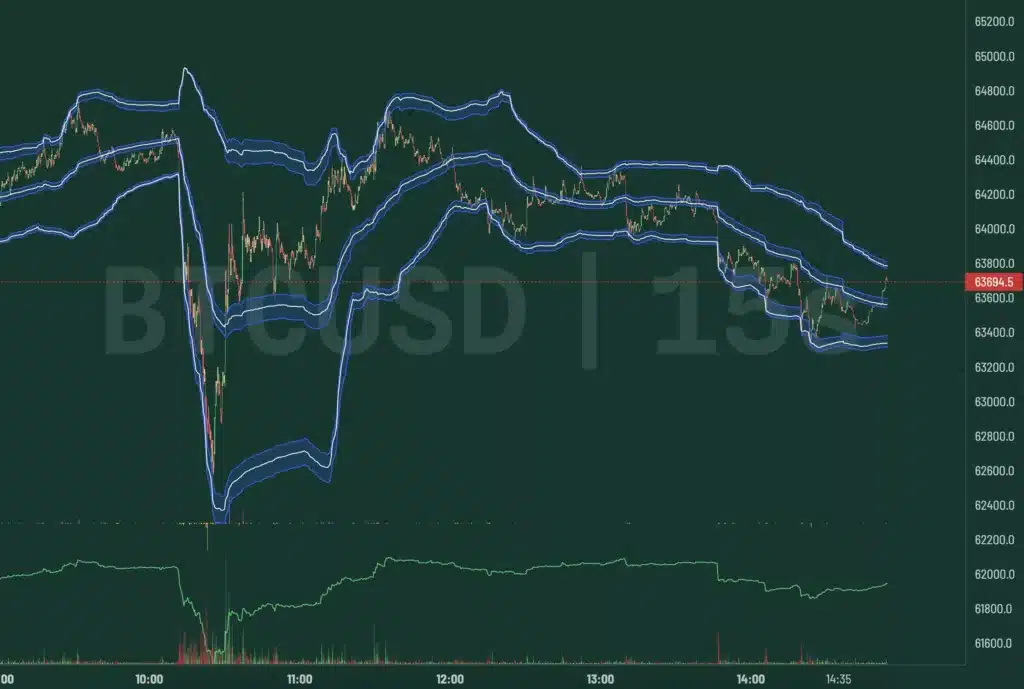
Smoothed VWAP bands are great for identifying areas with the most volume transacted. This indicator calculates VWAP based on the last 200 candles and then uses a standard deviation of 2 to create lower and upper bands. The VWAP bands represent areas of interest, so they usually give a reaction when price interacts with these areas.
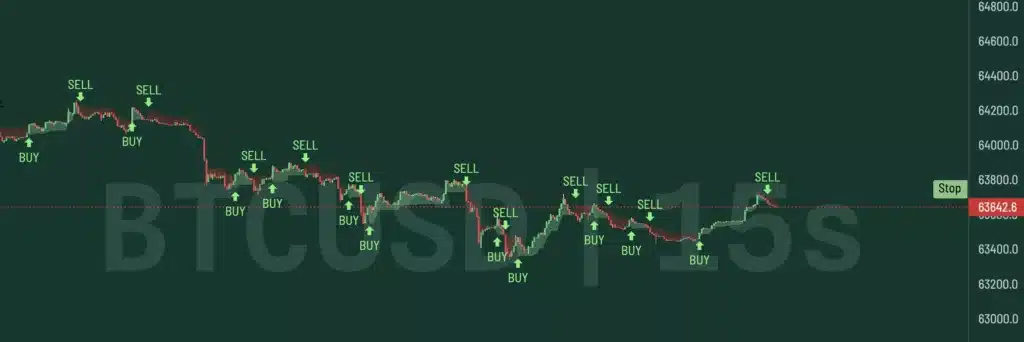
The chandelier exit indicator generates simple buy and sell signals. This indicator reacts quickly to a trailing stop loss level, which changes as the price evolves. The chandelier indicator can help you manage your risk when trading on super-low time frames. You can also look at the chandelier on higher time frames to gauge the direction of the market.
You can also customize the chandelier indicator settings to include more or less price history when generating signals, allowing you to adjust the indicator to whatever suits your trading style best. The chandelier indicator can give many false signals, so use it in combination with key levels and other indicators.
Monitor Perp & Spot Orders At Key Levels
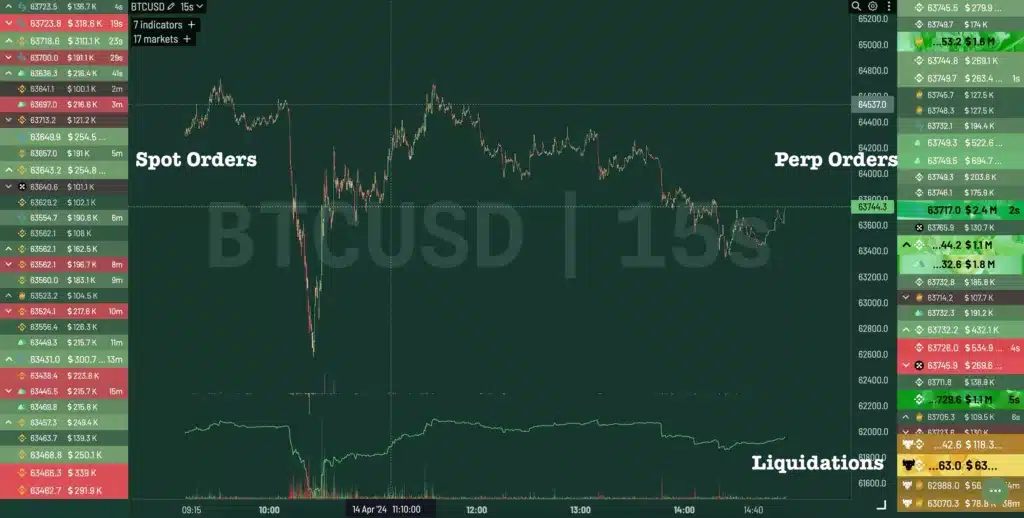
Another way to use Aggr to help with scalping is by watching/listening to the order book at key levels.
Ideally, you want to trade in sync with the aggressive buyers (perps) in the market. When scalping on a low time frame, you can ride the momentum of aggressive participants trading perps.
When price is at a key support/resistance levels, ideally you want to see some spot buys flowing in. This gives you confluence that the level will hold as support. If you see an absence of spot buying, you can look for a lower point of interest that will likely get tagged.
The Spot delta indicator is a good way to visualize if bulls or bears are in control at specific levels. Delta is calculated by subtracting the volume traded at the bid price from the volume traded at the asking price. Positive delta suggests buyers are in control, while negative delta gives control to sellers.
Use spot delta in combination with support resistance and the direction of aggressive participants to give yourself multiple points of confluence when making trades.
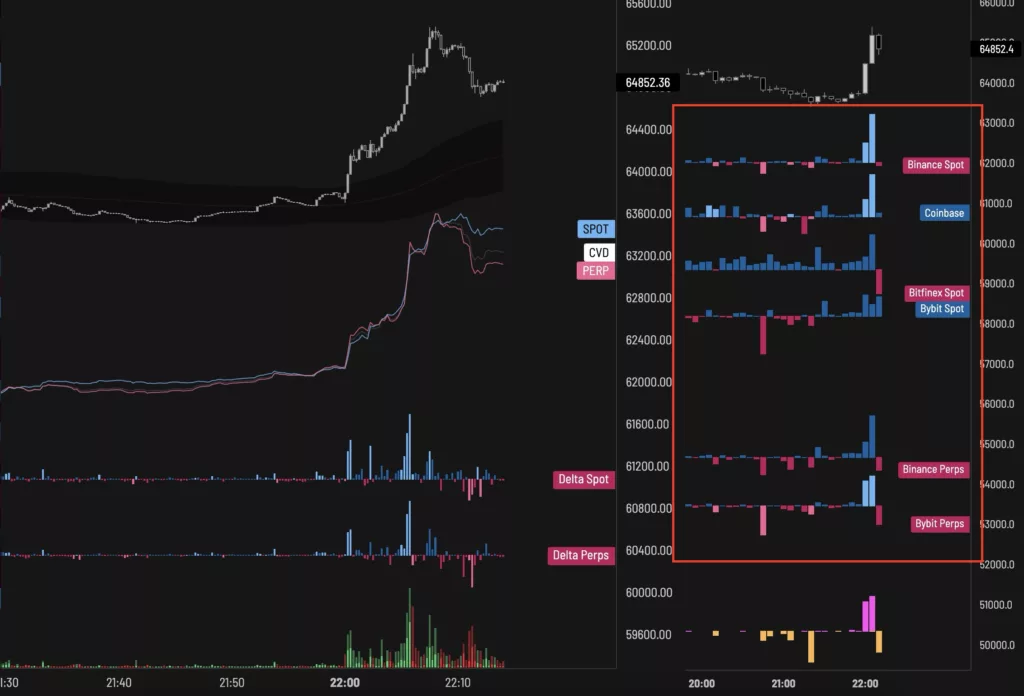
Using CryptoRife’s Aggr template, you can view delta organized by exchange.


3 Ways Aggr Can Make You A Better Trader